Geologist Mari Tarp settled a scientific dispute on the map of the ocean floor..
Something is loading. Thank you for subscribing! Get access to your favorite topics in a personalized feed while you're on the go.
Why do the continents of the Earth look like they fit together?
At the beginning of the 20th century, this was one of the biggest scientific mysteries in geology, and part of the solution lay on the ocean floor. Back then, no one knew what the ocean floor looked like—until one woman used her multiple talents to find out.
Remembering my life
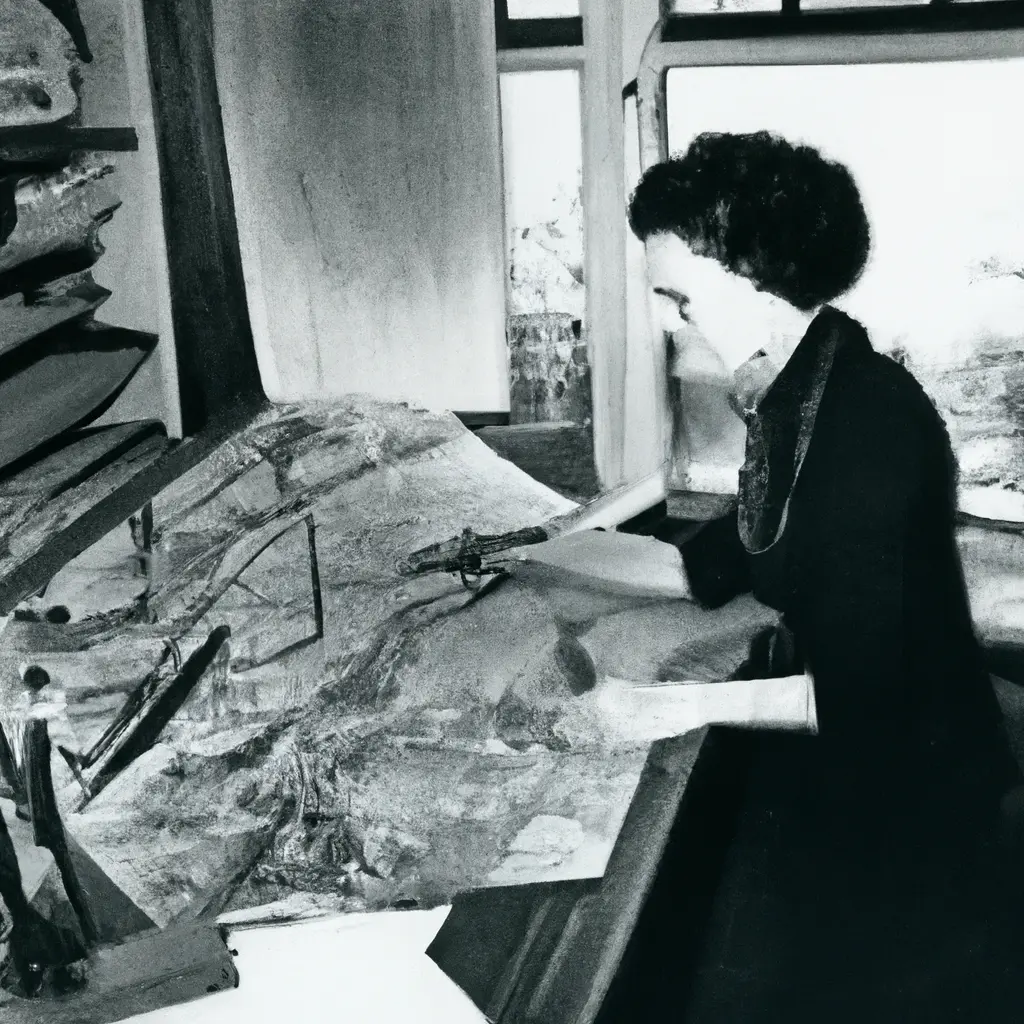
Geologist Marie Tharp recalled how she managed to fill in the gaps in the ocean floor, which she saw as an intriguing puzzle. She discovered mountains, volcanoes, and canyons hidden beneath the oceans, just as they exist above sea level.
“It was a one-time opportunity for anyone, but especially for a woman in the 1940s,” wrote Tarp. A geology specialist at the Lamont Geological Laboratory of Columbia University (now the Lamont-Doherty Earth Observatory), Tarp took deep-sea measurements on sheets of paper and turned them into incredible maps. Her maps not only helped her see the ocean floor in a completely new way, but also changed the perceptions of geologists and oceanographers about the Earth.
When Tarp was still in elementary school
Some scientists have challenged Alfred Wegener's theory of continental drift. The German meteorologist and astronomer Wegener first presented his ideas in 1912. Like others, he noticed that the continents appear as if they were once connected. Despite being separated by oceans, their mountain ranges matched up.
“It’s like we are collecting torn pieces of a newspaper, connecting them at the edges,” wrote Wegener in “The Origin of Continents and Oceans.” If he was right, then the movement of continents would explain many mysterious puzzles, such as why Australian marsupials are more similar to animals in South America than to those living closer in Asia.
The theory of Wegener gained support.
However, many American scientists found it implausible. One influential geologist, Bailey Willis, called it a "fairy tale." Instead, Willis adhered to his own theory that there were once land bridges between the continents that later sank.
When Tarp enrolled in a two-year geology program at the University of Michigan in 1943
Her teachers probably did not support Wegener's theory. There was still "no satisfactory unifying hypothesis that could explain the main features and processes on the Earth's surface," wrote geologist Betty Higgs about the formation of Tarp.
When Tarp arrived at Columbia University to work with Maurice Ewing at the Lamont Laboratory
She joined a group of about two dozen men and women in a team of geophysicists in 1948. Other women were mostly accountants, assistants, or human calculators handling mathematical calculations.
Like many of her male colleagues, Tarp held a master's degree in geology. However, she was not allowed to go on research vessels. Some sailors still believed it was "unlucky" to have a woman on board unless they were passengers. In 1956, graduate student Roberta Aitken was banned from participating in a fellowship after she managed to board a vessel in Massachusetts. Tarp did not embark on a mission until 1968.
Instead, Tarp spent most of her time helping the men with calculations and diagrams. After about three years, she almost left her job. It’s unclear whether she was burned out or frustrated that she was working on other people's projects instead of her own. But when she returned, she began a collaboration that changed the trajectory of her career.
By the early 1950s, echo sounders and precise depth gauges allowed scientists to continuously record the depths of the ocean floor.
giving them a more complete picture than ever before.
The only problem was that they produced an enormous amount of data. Bruce Heisen, who started working at the Lamont Laboratory around the same time as Tarp, handed this work over to her in 1952. There were long rolls of paper with lines that rose and fell depending on the time it took for the sonar to ping from the ocean floor to the ship.
Tarp's task was to translate 3,000 feet of paper and wavering lines into a map that contained all the data from various ships.


“The result ‘looked like a spider web,’ said Tarp, with lines resembling telephone wires stretching across the Atlantic Ocean.”
After several weeks of studying the data and drawing lines, Tarp noticed a pattern. She had about half a dozen lines crossing the ocean, and many of them had a V-shaped dip in the same spot, right on the underwater mountain range - the Mid-Atlantic Ridge.
It looked like a crack. But Heisen told her that it couldn't be so, because it would be too similar to continental drift. He and "almost everyone else at the Lamont Laboratory and in the U.S. believed that continental drift was impossible," according to Tarp. It took Heisen several months to accept what he had dismissed as "girl talk" from Tarp.
Meanwhile, Tarp and Hizen decided to use physiographic diagrams to capture what they observed in the data. If the sonar recorded a large mountain, Tarp would depict it as tall next to lower hills. In areas where the ships did not record depth, Tarp made educated guesses.
Shading and closely spaced lines created an illusion of depth, making sharp peaks and flat mountain tops appear to rise from the page. Tarp's map allowed both professionals and amateurs to gain insight into the underwater topography.
“But we had another hidden motivation,” Tarp wrote. “Detailed contour maps of the ocean floor were classified by the U.S. ship's crew, so physiographic diagrams provided us a way to publish our data.”
Hizen asked graduate student Howard Foster to place points at the latitudes and longitudes of tens of thousands of earthquake epicenters on another map. When Foster's map was laid over Tarp's diagram, the earthquakes snaked along the Mid-Atlantic Ridge, where it found a fault.
Then Tarp was able to use other seismic data to extend the ridge into the Indian Ocean and the East African Rift Valley. What Hizen later called a "monstrous scar" divided the globe into parts, and now the theory of continental drift seemed indisputable.
In 1956, Heisen and Ewing, the head of the Lamont Laboratory, published an article noting a ridge extending for about 40,000 miles across the ocean floor, without mentioning Tarp. Two years later, at the International Oceanographic Conference in 1959, Heisen gave a presentation on continental drift and rifting.
By this time, other researchers in several fields had gathered evidence supporting Wegener's theory. The proof of the Tarp fracture came from an unexpected source. At a conference, underwater explorer Jacques Cousteau showed a video he had filmed in the Rift Valley using an underwater camera.
Initially, Cousteau planned to prove that Tarp and Hizen were wrong. Instead, the footage "helped many people believe in our rift valley," Tarp said.
Over the next decade, scientists in various fields contributed to the theory of plate tectonics, offering new explanations for everything from oceanic faults to the formation of the Earth's crust.
Tarp and Hizen continued to collaborate until his death in 1977. Their last joint project was the Map of the Ocean Floor. They enlisted the artist Heinrich Berann, who had worked with them on many maps for National Geographic, to create it.
The map shows the mid-ocean ridge, winding its way around the world in a zigzag pattern. It seems that if you run your fingers over the paper, you could feel where it rises and falls.
After the death of Khizen, the organizations that hired him and Tarp for their projects reassigned them. A few years later, she was asked to retire from the Lamont Laboratory.
We will find property in France for you
- 🔸 Reliable new buildings and ready-made apartments
- 🔸 Without commissions and intermediaries
- 🔸 Online display and remote transaction
Our managers will help you choose a property
Liliya
International Real Estate Consultant

Subscribe to the newsletter from Hatamatata.com!
Subscribe to the newsletter from Hatamatata.com!
Popular Posts
We will find property in France for you
- 🔸 Reliable new buildings and ready-made apartments
- 🔸 Without commissions and intermediaries
- 🔸 Online display and remote transaction
Our managers will help you choose a property
Liliya
International Real Estate Consultant

Subscribe to the newsletter from Hatamatata.com!
Subscribe to the newsletter from Hatamatata.com!
I agree to the processing of personal data and confidentiality rules of Hatamatata
Popular Offers
Need advice on your situation?
Get a free consultation on purchasing real estate overseas. We’ll discuss your goals, suggest the best strategies and countries, and explain how to complete the purchase step by step. You’ll get clear answers to all your questions about buying, investing, and relocating abroad.


Irina Nikolaeva
Sales Director, HataMatata