


Where to Buy Rental Property in the U.S. in 2026: 10 Markets That Still Pay

Why 2026 is a different year for real estate USA investors
If you are hunting for real estate USA opportunities in 2026, the simple truth is this: the era of ultra‑cheap financing is over, and that changes how we choose markets. Mortgage rates are sitting in the mid range, inventory is improving in several metros, and investors who focus on cash flow rather than speculative price gains will find better odds of success.
We like markets where strong cash flow meets rising property values. That means mid‑sized metro areas with steady job growth, low entry prices and tenant pools tied to healthcare, education or tech. The list that follows highlights cities that answered those criteria in current data and local indicators. I will also explain the underwriting rules I use, where the risks lie, and how to compare a deal in practice.
The 10 U.S. markets to watch in 2026
Below I rank the markets the way I evaluate them for buy‑and‑hold rental property. For each city I cite the most relevant driver of demand and the headline yield or growth figure cited in recent market reports.
1. Indianapolis, Indiana — Cash‑flow leader
- Driver: Healthcare (Eli Lilly and other employers) and a steady student market (IUPUI).
- Headline metric: Projected gross yield of 9.1%.
Why it matters: Indianapolis is one of the most reliable markets for investors chasing monthly income. The city mixes affordable acquisition costs with steady rental demand from medical workers and students. Public projects such as transit corridors add to long‑term access and tenant appeal.
2. Buffalo, New York — Value with work‑force demand
- Driver: Healthcare, education and in‑migration of residents seeking affordability.
- Headline metric: Gross yield of 8.2%.
Why it matters: Buffalo offers low barriers to entry and improving fundamentals. Investors who buy multifamily units can often achieve higher cap rates than in coastal metros.
3. Dallas–Fort Worth, Texas — Scale and corporate relocations
- Driver: Massive corporate moves, no state income tax.
- Headline signal: Market rated #1 overall prospect by PwC.
Why it matters: DFW is about long‑term appreciation and rent demand at scale. Prices are higher than in Midwest markets, but migration and job growth underpin steady leasing pipelines.
4. Raleigh–Durham, North Carolina — Tech and medical hiring hub
- Driver: Research Triangle Park, universities and medical centers.
- Headline metric: Rent growth of about 1.6%.
Why it matters: This is a conservative growth play: stable tenants, university‑tied demand and diversified employers reduce vacancy risk.
5. Tampa, Florida — Hybrid yield and demographic tailwinds
- Driver: Tourism and retiree in‑migration.
- Caution: Insurance costs are rising quickly.
Why it matters: Tampa can be a high‑yield hybrid play (shorter‑term and long‑term renters), but underwriting must account for escalating insurance premiums and property tax pressure.
6. Hartford, Connecticut — Overlooked upside
- Driver: Commuter access to NYC/Boston and local inventory constraints.
- Headline metric: Realtor.com projected combined growth of 17.1%.
Why it matters: Hartford is a value play with outsized appreciation projections. That projection merits careful verification against local supply and employer trends, but the upside is measurable.
7. Charlotte, North Carolina — Banking center attracting young workers
- Driver: Financial services and a rising young professional population.
- Headline metric: Rent growth of 2.1%.
Why it matters: Charlotte mixes rental demand with demographic change: more single professionals and young families who rent before buying.
8. Phoenix, Arizona — Southwest relocation story
- Driver: West Coast relocations and semiconductor/manufacturing jobs.
Why it matters: Phoenix offers buy‑and‑hold upside for SFRs, but the city is expanding fast. That means submarket selection matters; not all neighborhoods will produce the same rent growth or vacancy stability.
9.


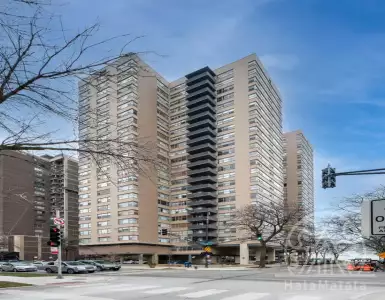




- Driver: Intel expansion and Ohio State University tenant demand.
Why it matters: Columbus keeps entry costs low while supporting steady renter pools tied to manufacturing and higher education.
10. Jacksonville, Florida — First‑time renter pool and coastal appeal
- Driver: First‑time buyer market feeding robust renter demand.
Why it matters: Jacksonville provides a coastal option where entry prices can still deliver good cash flow; it is a sensible market for investors seeking balance between appreciation and rentability.
My underwriting rules for 2026: what I use to decide
Higher‑for‑longer interest rates change the math on deals. I am shifting from betting on appreciation toward mechanical income metrics. These are the hard rules I apply before making an offer.
- 1% Rule or Net Yield: I use the 1% Rule as a quick screen — monthly gross rent close to 1% of purchase price. If that fails, I check the market average gross yield and look for 6%–8% as a target range.
- Stress Test: I stress test NOI by modeling a 15% increase in operating expenses by year three to reflect rising insurance and taxes in certain markets.
- Vacancy Standard: I prefer submarkets with historical vacancy rates under 6%; higher vacancy increases carrying cost risk when financing costs are elevated.
- Asset Type Priority: I prioritize multifamily and single‑family rentals (SFRs) located near hospitals, universities or major transit nodes; those tenants remain resilient through economic cycles.
- Cap Rate vs Growth: For value plays like Buffalo and Indianapolis, I weight cap rate more heavily. For growth metros such as Dallas and Phoenix, I balance cap rate with expected appreciation.
These rules force hard comparisons across deals and strip emotion from bidding. If a property fails the 1% Rule and yields below 6% gross, I require a stronger narrative for appreciation before I proceed.
Case study: two Texas properties compared in practice
Norada Real Estate provided two side‑by‑side listings that make the tradeoffs clear.
Converse, TX — Shadow Crest Dr.
- Price: $250,000
- Rent: $2,005
- Cap Rate: 6.2%
- NOI: $1,282
- Year Built: 1996
- Price/Sq Ft: $163
- Neighborhood: B
San Antonio, TX — Bending Elms
- Price: $250,000
- Rent: $1,875
- Cap Rate: 5.0%
- NOI: $1,040
- Year Built: 2003
- Price/Sq Ft: $116
- Neighborhood: B+
How I read these numbers:
- Cash flow: Converse delivers a stronger cap rate (6.2%) and higher monthly rent relative to price. That is attractive for investors focused on cash flow.
- Asset quality and upside: San Antonio's newer build and better neighborhood grade (B+) may mean lower maintenance, stronger appreciation and easier refinancing later, even if initial cap rate is lower.
- Fit to strategy: If your goal is immediate positive cash flow, Converse is the cleaner choice. If your strategy prioritizes lower maintenance and a higher resale value, San Antonio may fit better.
A disciplined investor quantifies both cases: run a 15% expense stress test, model interest rate sensitivity, and check local vacancy history. The numbers above do not lie, but contextual underwriting decides the winner.
Key risks investors must manage in 2026
The markets above have real upside, but risks are real. Here are the main hazards and pragmatic mitigations.
-
Interest rates and financing risk
- Risk: “Higher‑for‑longer” mortgage rates erode cash flow and increase debt service.
- Mitigation: Lock longer term fixed rates when possible, or buy with larger down payments to preserve spread between rent and financing costs.
-
Rising insurance and property taxes
- Risk: Markets like Tampa and Phoenix show rapid insurance premium growth.
- Mitigation: Build conservative expense buffers (the 15% stress test), shop multiple insurers, and check flood or wildfire zone designations before purchase.
-
Submarket variability
- Risk: City‑level stats hide block‑to‑block differences.
- Mitigation: Use local brokers and on‑the‑ground property managers; prefer assets near hospitals, universities, or transit to protect occupancy.
-
Vacancy and tenant quality
- Risk: Higher vacancy raises carrying costs quickly when rates are elevated.
- Mitigation: Underwrite to historical vacancy under 6%, require renter insurance, and aim for leased-up properties or proven rent rolls when possible.
-
Political and regulatory shifts
- Risk: Local rent control or changes to short‑term rental rules can affect revenue.
- Mitigation: Monitor local ordinances, diversify across several markets, and avoid speculative positions in cities with uncertain regulation.
Practical steps for investors ready to act
If you are preparing to buy in 2026, here is a checklist to move from idea to contract without overpaying.
- Start with a market screen: look for gross yields above 6% or 1% Rule candidates.
- Validate local demand: verify employment growth, major employers, and enrollment figures for universities or hospitals.
- Run a 15% expense stress test and a worst‑case vacancy scenario.
- Compare cap rate to neighborhood comps, not city averages.
- Factor transaction costs and rehab budgets into your offer; a low purchase price can be eaten by repairs.
- Use local property managers for tenant screening and rent collections; they are the frontline risk control.
- Consider working with a buyer’s counselor or a firm that has inventory beyond online listings if you invest out of state.
What this all means for different investor types
- The income‑first investor: Focus on Indianapolis, Buffalo, Columbus and parts of Jacksonville for higher gross yields.
- The appreciation‑oriented investor: Consider Hartford, Dallas–Fort Worth and Charlotte where job growth and housing supply dynamics support price gains.
- The hybrid investor: Tampa and Phoenix can provide a mix of rent and appreciation but require tighter expense underwriting.
I recommend matching market choice to your financing profile. If you hold adjustable debt or plan to refinance in a few years, favor higher cap rates and lower entry prices; if you hold cash or fixed long‑term debt, you can accept lower initial cap rates for neighborhoods with stronger appreciation prospects.
Frequently Asked Questions
Q: Are high cap rates always better?
A: No. High cap rates usually mean lower purchase prices relative to rent, which is good for cash flow. But they can also indicate higher neighborhood risk, older assets, or weaker tenant pools. Always pair cap rate with neighborhood grade, vacancy history and expected maintenance.
Q: Is the 1% Rule still useful in 2026?
A: Yes as a quick screen. The 1% Rule filters deals that are likely to produce immediate cash flow. When it fails, require a gross yield of 6%–8% or a strong appreciation thesis to justify the purchase.
Q: How should I treat rising insurance and property taxes?
A: Model a 15% increase in operating costs by year three and verify whether the property lies in flood or other high‑risk zones. In some Florida and Arizona markets, insurance has become a material line item that changes deal math.
Q: Should out‑of‑state investors buy in these markets?
A: Yes, if they use strong local partners. Out‑of‑state investing is workable if you have a reliable local property manager, understand submarket differences, and build a buffer for unexpected repairs and vacancy.
Bottom line and practical takeaway
2026 favors disciplined underwriting over speculation. If you want dependable cash flow, target markets and properties that meet the 1% Rule or deliver gross yields of 6%–8%, stress test expenses by 15%, and keep vacancies under 6% in your models. Among the cities listed, Indianapolis (9.1% gross yield) and Buffalo (8.2% gross yield) are the clearest examples where cash flow and affordability align. If you proceed, document every assumption and verify local data before your offer; that approach separates profitable buys from costly mistakes.
Tags
We will find property in USA for you
- 🔸 Reliable new buildings and ready-made apartments
- 🔸 Without commissions and intermediaries
- 🔸 Online display and remote transaction

International Real Estate Consultant

Subscribe to the newsletter from Hatamatata.com!
Subscribe to the newsletter from Hatamatata.com!
Popular Posts

We will find property in USA for you
- 🔸 Reliable new buildings and ready-made apartments
- 🔸 Without commissions and intermediaries
- 🔸 Online display and remote transaction
International Real Estate Consultant

Subscribe to the newsletter from Hatamatata.com!
Subscribe to the newsletter from Hatamatata.com!
I agree to the processing of personal data and confidentiality rules of HatamatataPopular Offers

 3
3
 120
120
 5
143
5
143
 2
165
2
165
Need advice on your situation?
Get a free consultation on purchasing real estate overseas. We’ll discuss your goals, suggest the best strategies and countries, and explain how to complete the purchase step by step. You’ll get clear answers to all your questions about buying, investing, and relocating abroad.



Sales Director, HataMatata