


Housing Demand Held Through July 4—Midwest Lead, Grand Rapids Nears Zero Inventory

Holiday noise hid a real trend: demand held in US real estate
The Fourth of July made the weekly housing snapshot look softer than the market actually is. New listings and pending contracts fell during the holiday week, but when we compare the data year over year the picture changes: new pending contracts rose 4.6%, total pending inventory increased 4.1%, and estimated home sales climbed 5.6%. That matters for anyone tracking the real estate USA market because it shows demand has not evaporated even as mortgage rates edged higher.
Mortgage rates moved toward the upper end of HousingWire lead analyst Logan Mohtashami’s forecast range as geopolitical tensions pushed Treasury yields up, and the holiday slowdown pulled buyers and sellers out of the market. Still, the underlying data points to steady buyer activity when you strip out seasonal noise. Our analysis uses the HousingWire Data snapshot through Friday, July 10, 2026, with year-over-year comparisons to the week ending July 11, 2025.
National snapshot: holiday dip vs underlying momentum
On the surface, the weekly totals looked weaker: new listings fell from 75,360 to 63,405, and new pending contracts dropped from 71,173 to 63,971. Those are normal, temporary effects around a major holiday. The clearer read comes from year-over-year figures and pipeline measures:
- New pending contracts up 4.6% year over year
- Total pending inventory up 4.1%
- Estimated home sales up 5.6%
Those figures tell a consistent story: demand is holding. But that demand is concentrated in specific metros and regions. Over the last two years the US housing market has become more local, and the latest data reinforces that view.
Three metros that explain where demand is actually concentrated
Not every metro behaved the same. Three stood out in the July snapshot because they each reveal a different stage of market adjustment.
Grand Rapids: a seller’s market with rapid turnover
Grand Rapids, Michigan, remains exceptionally tight. The market has 0.8 months of inventory, meaning less than one month’s supply at the current pace of sales. The velocity ratio is 2.09, which means more than two homes went under contract for every new listing last week. Homes are moving fast — median days on market to contract is 7 days — and price pressure is visible as the share of active listings with price reductions has fallen to 17.9%, down from 38.3% a year earlier.
What this means for buyers and investors:
- Buyers face competition and will need realistic offers and pre-approval strength.
- Investors looking for quick flips will find low holding time but should budget for limited inventory sourcing.
- Sellers can maintain pricing power, but they must still manage inspection and appraisal contingencies carefully to close.
Cape Coral-Fort Myers: inventory correction reversing
A year ago Cape Coral-Fort Myers was dealing with an inventory glut. Active inventory had spiked to 9,422 homes and months of inventory hit 7.0. The market has since trimmed that overhang: active inventory is now 6,296, a 33.2% drop year over year. Absorption — the number of homes absorbed by the market — rose 62.8%, while the share of listings with price cuts fell slightly from 46.9% to 43%. Even though the median days on market remains long at 112 days, the trajectory is toward clearing excess supply.
Implications:
- Buyers may regain negotiating leverage compared with a year ago, but homes can still linger.
- Developers and builders should watch absorption closely; continued improvement could justify resuming constrained starts in select neighborhoods.
- Investors should prefer neighborhoods where absorption is outpacing new supply.
Bridgeport-Stamford-Norwalk: luxury demand holding at higher rates
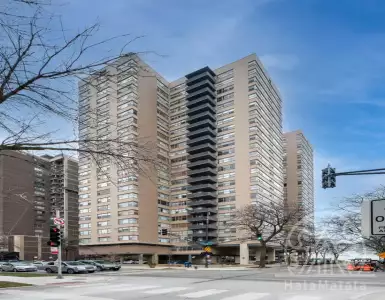
Higher-rate environments usually dent high-priced markets first, but Bridgeport-Stamford-Norwalk in Connecticut is bucking that expectation. New pending contracts jumped 28% year over year and absorbed inventory rose 21.9%.





Investor note:
- High-net-worth buyers in some coastal suburbs still transact even when financing costs rise, often using larger down payments or cash.
- Lenders and agents should verify financing sustainability; mortgages on expensive properties are more sensitive to rate movement.
The Midwest rotation: affordability translating into activity
If one regional pattern kept appearing in the data it was strength across the Midwest. Grand Rapids was not alone.
- Dayton, Ohio: absorbed homes rose 39%, and estimated sales increased 42.3% year over year.
- Wichita, Kansas: absorbed inventory rose 37.9%, and new pending contracts increased 34.8%.
- Cleveland, Ohio: absorption climbed 23.9%.
- Des Moines, Iowa posted gains in both pending contracts and absorbed inventory.
Why the Midwest is outperforming
- Affordability: much of the Midwest entered this rate cycle with lower price-to-income ratios than coastal and some Sun Belt markets.
- Supply balance: inventory never reached the extremes seen in many pandemic-boom metros, so markets had less overhang to work through.
- Local economies: stable or improving employment in manufacturing, logistics, and healthcare is supporting housing demand.
For buyers and investors this regional rotation matters. If affordability and reasonable inventory levels persist, Midwest properties offer lower acquisition costs and shorter time-to-sale than many coastal alternatives. Our analysis suggests the rotation into the Midwest is not a single-week blip; it has been building for months and is now visible consistently in the data.
Augusta’s relist anomaly: a warning sign for closings
One market stood out for the wrong reasons: Augusta, Georgia. More than 40% of active listings were relisted after previously leaving the market, compared with 4.8% a year ago. Historically the relist rate rarely climbed above 7%, yet since late May the relist rate has not fallen below 40%, peaking at more than 64% in late May and easing to 40.6% last week.
That’s a strong sign something unusual is happening locally. The dataset does not explain the cause, but plausible explanations include:
- Listing behavior changes, such as strategic relists by agents to refresh exposure.
- Transaction activity issues, including financing failures, appraisal gaps, or inspection fallout.
- Administrative or title problems causing repeat relists.
Why buyers and agents should care
- A high relist rate can indicate deals that fail to close; agents should probe the quality of the pipeline, not just contract counts.
- Lenders need to scrutinize pre-approval documentation and underwriting steps when operating in a market with elevated relists.
- Investors should avoid assuming that relisted homes will translate into immediate closed deals; factor in longer timelines and potential carrying costs.
What this means for different market participants
We translate the data into practical steps for buyers, sellers, agents, lenders and investors.
For buyers:
- Prioritize markets with improving absorption and falling inventory rather than relying on national headlines.
- In tight metros like Grand Rapids expect multiple-offer scenarios; strong pre-approval and fast response matter.
- In recovery markets like Cape Coral plan for longer marketing periods and watch price adjustment trends.
For sellers:
- In tight markets you can command better pricing, but closing risk still exists; vet offers carefully.
- In recovery markets time your pricing strategy to balance speed and net proceeds; reducing the likelihood of a price cut helps attract qualified buyers.
For agents and lenders:
- Focus on pipeline quality: verify buyer financing and anticipate appraisal contingencies.
- Track relist rates and velocity ratios at the ZIP code level to identify transactions at higher risk of failing.
For investors and builders:
- Look beyond headline growth: target metros where absorption is rising faster than new supply.
- The Midwest currently offers a durable mix of affordability and strengthening demand.
Key metrics every professional should monitor weekly
Tracking the right indicators matters more than watching raw headlines. These metrics provided the clearest signals in the HousingWire snapshot:
- Months of inventory (supply measured in months at the current sales pace)
- Velocity ratio (homes under contract per new listing)
- Absorbed inventory (homes sold/absorbed in the period)
- Share of active listings with price reductions
- Relist rate (percentage of active listings that were previously listed)
- Median days on market
Using those metrics helps you see whether a market is supply-constrained, correcting toward balance, or suffering transactional friction.
Risks and signals to watch this summer
The national trend points to demand holding, but there are clear risks and local signals to watch:
- Mortgage rates: if Treasury yields keep climbing, borrowing costs will rise and could slow high-end markets where leverage is more common.
- Relist spikes: markets like Augusta that have elevated relist rates may reveal closing problems or local structural issues.
- Inventory shifts: markets that reduce months of inventory quickly can flip from buyer- to seller-favoring conditions, changing negotiation dynamics.
We expect three signals to be decisive over the next few months: whether pending contracts rebound after holiday noise, whether Midwest metros continue to outpace the national average, and whether Augusta’s relist rate returns to historical norms or stays elevated.
How to use HousingWire Data and what the numbers mean in practice
HousingWire’s proprietary dataset provides metro- and ZIP-level measures for inventory, pricing, demand and market activity. The July snapshot covers single-family homes across all price quartiles and compares the week ending July 10, 2026 to the same week a year earlier. When you use this sort of data you should:
- Combine national trend analysis with ZIP-level metrics to avoid false signals.
- Use velocity and relist rates as early-warning indicators for transactional failure.
- Cross-check employment, mortgage rate trends and new construction starts for a fuller picture.
Frequently Asked Questions
Q: Is the national housing market weakening because of the July 4 holiday dip?
A: No. The holiday caused lower activity in the week-to-week totals, but year-over-year metrics show demand held: new pending contracts +4.6%, total pending inventory +4.1%, and estimated home sales +5.6%.
Q: Which metros are the strongest right now?
A: The strongest metros in this snapshot are Grand Rapids, MI (tight inventory, velocity ratio 2.09), parts of the Midwest like Dayton and Wichita where absorption is up markedly, and Bridgeport, CT where luxury demand is holding despite higher rates.
Q: Should investors pivot to the Midwest?
A: The Midwest is an attractive option because of better affordability and steady absorption. Look for metros where absorption is rising faster than new supply; examples include Dayton (absorption +39%) and Wichita (absorption +37.9%).
Q: What does Augusta’s high relist rate mean for transactions?
A: A relist rate above 40% is an outlier that suggests deals are failing to close or listing behavior has changed. Agents and lenders should verify financing and title status carefully before counting contracts as reliable pipeline.
Bottom line
National headlines mask important local differences. Demand held through the holiday week — pending contracts rose 4.6% year over year — but where you operate matters. Grand Rapids is effectively out of supply, Cape Coral is working through excess inventory, Bridgeport shows resilience at the high end, and the Midwest is the primary growth corridor right now. Keep watching pending inventory, absorption and relist rates to separate true market strength from noisy headline moves; if Augusta’s relist rate stays above 40% into August, expect persistent local closing challenges that will matter to buyers, sellers and lenders.
We will find property in USA for you
- 🔸 Reliable new buildings and ready-made apartments
- 🔸 Without commissions and intermediaries
- 🔸 Online display and remote transaction

International Real Estate Consultant

Subscribe to the newsletter from Hatamatata.com!
Subscribe to the newsletter from Hatamatata.com!
Popular Posts

We will find property in USA for you
- 🔸 Reliable new buildings and ready-made apartments
- 🔸 Without commissions and intermediaries
- 🔸 Online display and remote transaction
International Real Estate Consultant

Subscribe to the newsletter from Hatamatata.com!
Subscribe to the newsletter from Hatamatata.com!
I agree to the processing of personal data and confidentiality rules of HatamatataPopular Offers

 1
1
 0
0

 2
2
80
2
2
80
 4
4
166
4
4
166
Need advice on your situation?
Get a free consultation on purchasing real estate overseas. We’ll discuss your goals, suggest the best strategies and countries, and explain how to complete the purchase step by step. You’ll get clear answers to all your questions about buying, investing, and relocating abroad.



Sales Director, HataMatata