Real estate market: Italian rental data for January 2024 - News from Immobiliare.it

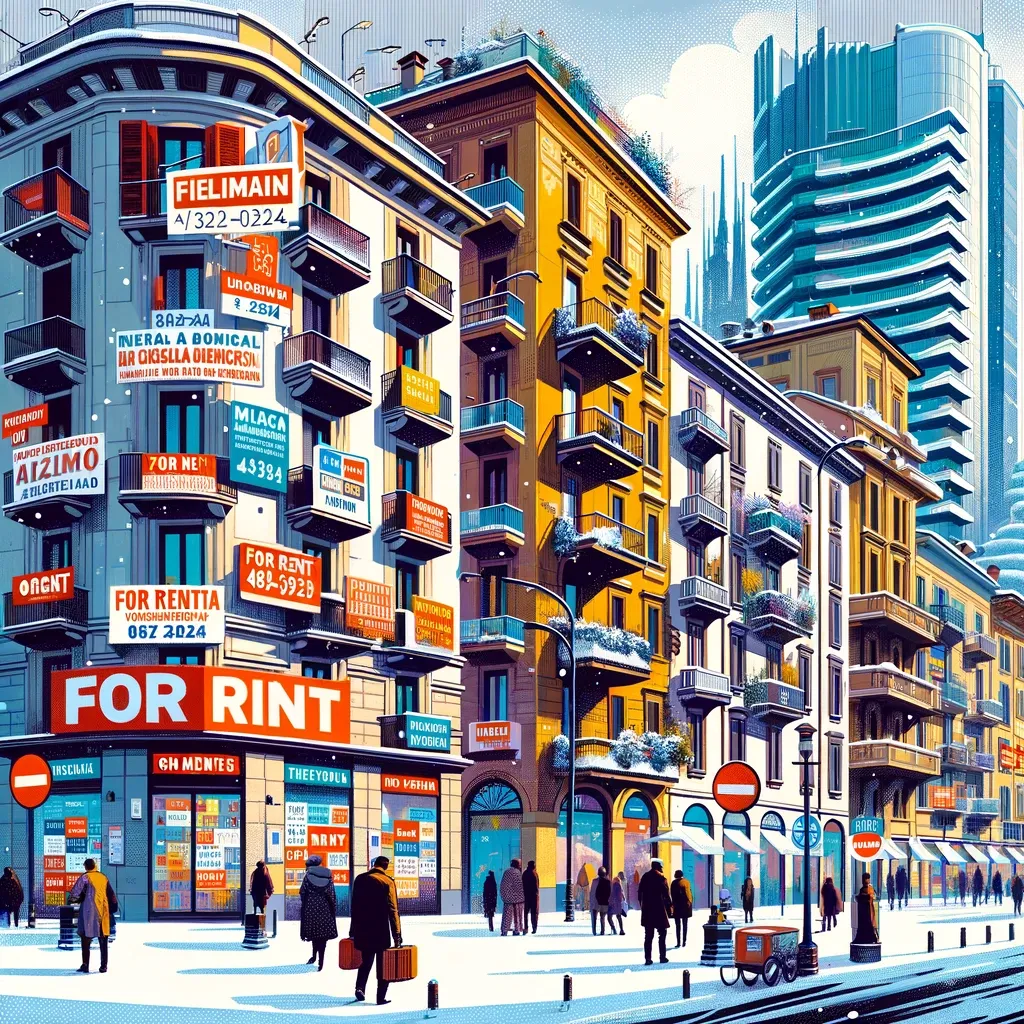
The data on residential rents in Italy in January 2024 in the Monthly Survey of Immobiliare.it Insights, the proptech company of the Immobiliare.it Group, speak for themselves: Milan remains Italy's most expensive city in terms of rental prices, with the most significant increases in average prices in the outskirts, the most economical neighborhoods, where demand is growing rapidly and supply is less. Find out all about demand, supply, average price and trends in the rental market in January 2024.
Demand
In January 2024, demand for rental properties in Italy grew evenly across the peninsula. The national figure stands at +19.6%. Demand, especially in the South, grew most significantly with a figure of +21.1%, followed by the Northwest with +20.8%. Isles is at the end of the list with a statistic of +18.6%.
Geographic areas:
- 1-month demand delta: North-West (+20.8%), North-East (+19.1%), Center (+19.3%), South (+21.1%), Isles (+18.6%), ITALY (+19.6%)
Demand rises in Trieste, falls in Aosta. Analyzing the data of the regional capitals, the most outstanding monthly increase in demand is Trieste, where demand has increased by 53.4% compared to December 2023. Significant increases are also noticed in the cities of Catanzaro: +35.2%; Genoa: +34.1%; Bologna: +33.4%; Potenza: +33.0%; Venice: +32.9%. The figure was +18.5% in Milan, +19.5% in Rome. There are also regional capitals where the demand for rental properties in the first month of 2024 decreased compared to the previous month: Ancona: -1.8%; Perugia: -13.0%; Aosta: -45.9%.
Suggestion
There is a slight increase in the supply of rental properties, which is still growing throughout Italy with a statistic of +10.5%.
Geographic areas:
- 1-month supply delta: North-West (+12.4%), North-East (+8.0%), Center (+10.6%), South (+9.0%), Isles (+6.2%), ITALY (+10.5%)
Growth in Aosta and Florence. The supply figure does not match the demand figure for rental properties. In fact, in the ranking of regional capitals where supply has increased most significantly over the past month, the top places are: Aosta: +57.1%; Florence: +46.0%; Perugia: +35.0%. It is interesting to note Aosta, which shows the most significant decrease in demand (-45.9%) and a simultaneous increase in supply (+57.1%).
Average price per square meter
Average rental prices per square meter for houses remained relatively unchanged across the country compared to the end of 2023. The national average is €12.9/m² with an increase of 0.8%.
Geographic areas:
- Northwest: €14.3/m² (+1.4%); Northeast: €12.1/m² (+0.9%); Center: €13.3/m² (+0.2%); South: €9.2/m² (+1.6%); Islands: €8.4/m² (-0.9%); ITALY: €12.9/m² (+0.8%)
Milan is the most expensive city: an increase in average prices in "affordable" neighborhoods. Milan remains the most expensive city in Italy not only for buying but also for renting: in January 2024, the average price per square meter increased (albeit slightly) by 0.7%, reaching €23.1/m². The most expensive neighborhoods in Milan for renters are: Center: €31.4/m² (+0.0%); Garibaldi, Moscova, Porta Nuova: €30.1/m² (-0.9%); Arco della Pace, Arena, Pagano: €27.9/m² (-0.1%); Quadrilatero, Palestro, Guastalla: €27.8/m² (-0.5%). The most affordable neighborhoods are: Biskegli, Baggio, Olmi: €16.5/m² (+4.1%); Ponte Lambro, Santa Giulia: €17.5/m² (+2.0%); Cimiano, Crescenzago, Adriano, and San Siro, Treno: €19.0/m² (respectively +1.6% and +2.2%). The most significant figures (i.e., the highest increase in average price per square meter compared to the previous month) are observed in the more affordable neighborhoods, where demand in January 2024 significantly increased, while supply growth was more moderate. For example, in Biskegli, Baggio, Olmi: demand: +72.3%; supply: +11.3%; average price: +4.1%. Florence takes the silver medal in the ranking of the most expensive capitals in Italy with €22.0/m² (and a more significant increase: +2.5%). Below the threshold of €22 per square meter are: Bologna: €18.1/m² (+0.8%); Rome: €15.9/m² (+1.2%); Venice: €15.4/m² (+1.6%). The most affordable capitals for rent (below €10 per square meter) include: Potenza: €6.6/m² (+0.8%); Campobasso: €7.2/m² (+4.8%); Catanzaro: €7.7/m² (-2.7%); Perugia: €8.1/m² (+0.5%); Palermo: €8.5/m² (+0.9%); Ancona: €8.7/m² (-0.3%); Aosta: €9.1/m² (-0.8%).
Tags
Comment
Popular Posts
14 May 2025
1441
1 May 2025
304
Popular Offers

Subscribe to the newsletter from Hatamatata.com!
Subscribe to the newsletter from Hatamatata.com!
I agree to the processing of personal data and confidentiality rules of Hatamatata


